Maintaining Neutral Rating On Consolidated Edison Despite Share Price Weakness
Geoff Considine, Ph.D | Nov 30, 2021 21:53
Consolidated Edison (NYSE:ED) reported consensus outlook combines the views of 16 analysts. The consensus rating is bearish and the consensus 12-month price target is 8.2% below the current share price.
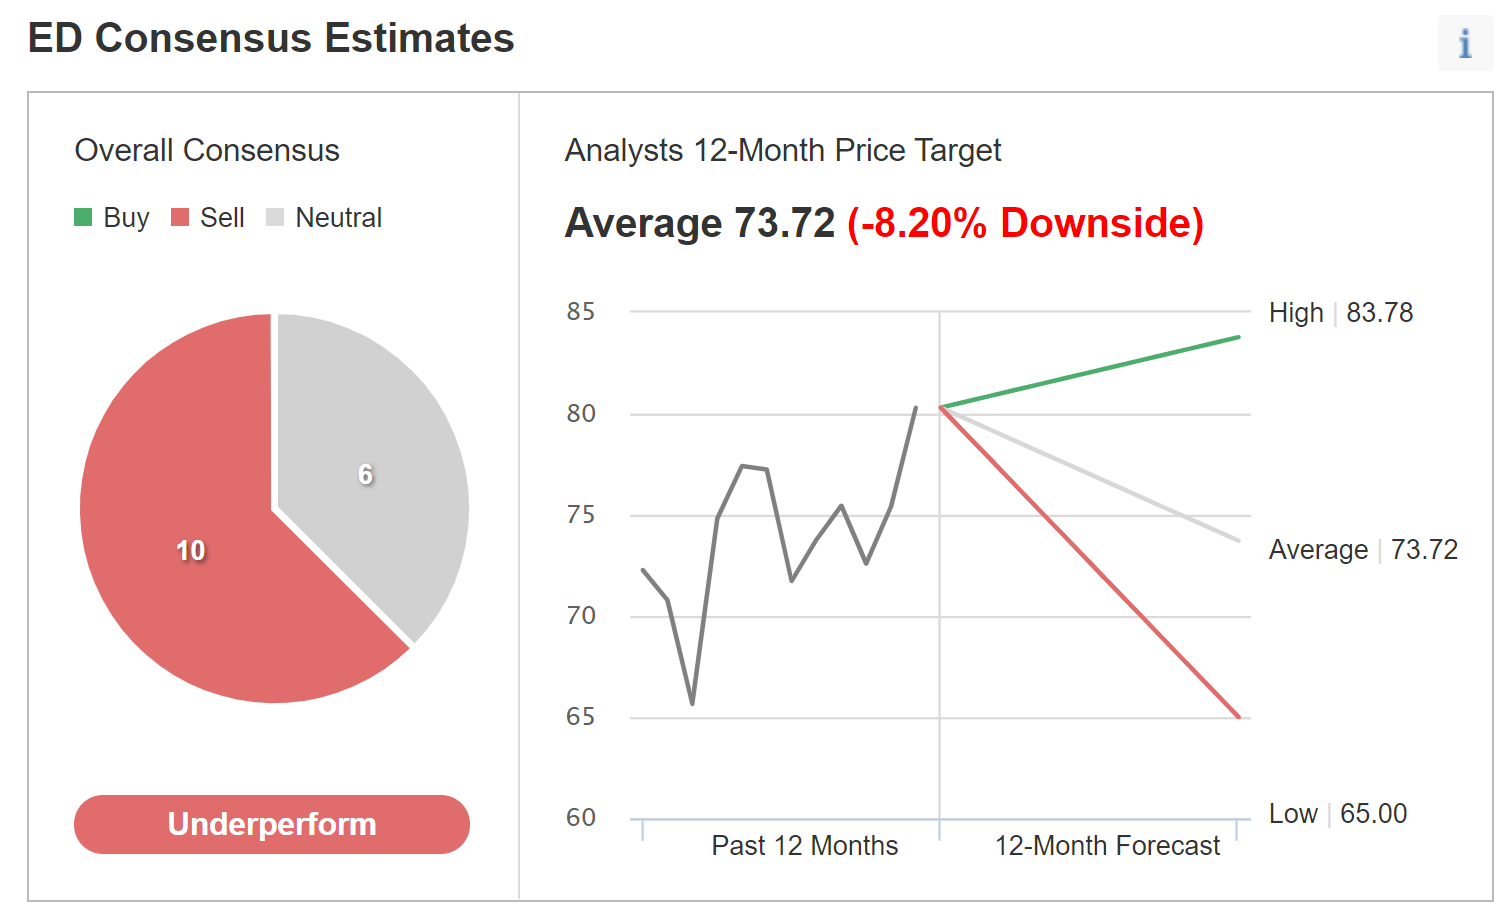
Source: Investing.com
The two versions of Wall Street consensus outlooks agree on a bearish outlook, with an expected 12-month price target that is about 10% below the current share price. The analyst consensus has been bearish over the last year (the E-Trade rating chart shows the consensus rating over time), and ED has provided almost zero price appreciation over this period.
Market-Implied Outlook for ED
I have calculated the market-implied outlooks for ED to January 2022 (using prices of options that expire on Jan. 21, 2022) and to January 2023 (using prices of options that expire on Jan. 20, 2023). The standard presentation of the market-implied outlook is in the form of a probability distribution of price return, with probability on the vertical axis and return on the horizontal axis.
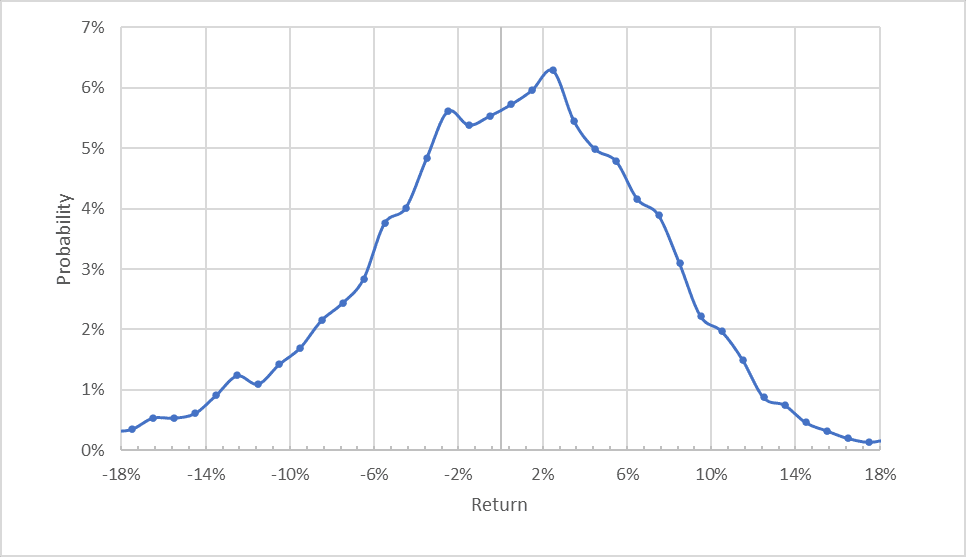
Source: Author’s calculations using options quotes from E-Trade
The outlook for the 1.7 months to Jan. 21, 2022 is generally symmetric, but the maximum probabilities are tilted to favor positive returns. The peak probability corresponds to a price return of 2.5% over this period. The annualized volatility calculated from this distribution is 19.7%, which is low for an individual stock but not unusually low for a utility.
To make it easier to directly compare the probabilities of positive and negative returns, I rotate the negative return side of the distribution about the vertical axis (see chart below).
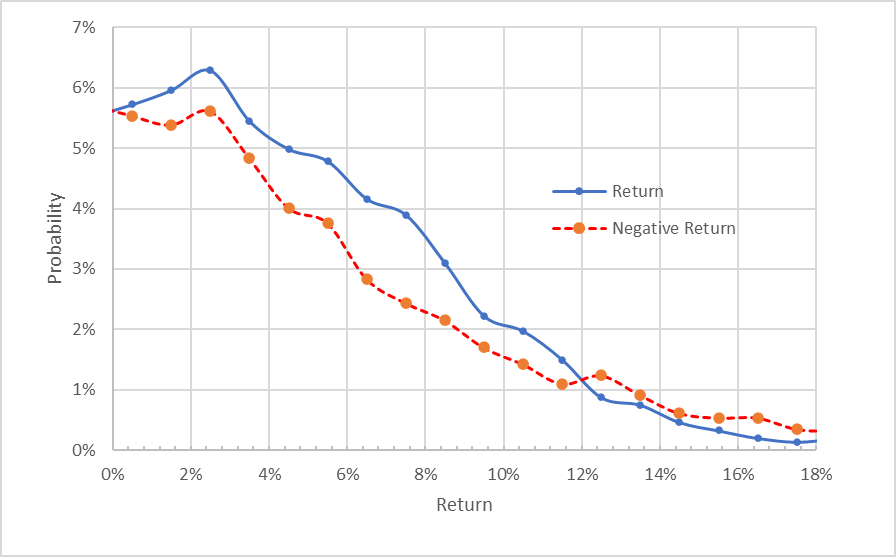
Source: Author’s calculations using options quotes from E-Trade. The negative return side of the distribution has been rotated about the vertical axis.
With this view, the degree to which the outlook favors positive price returns over the next couple of months is even clearer. The probabilities of positive returns are consistently higher than for negative returns of the same magnitude for a wide range of the most-probable outcomes (the solid blue line is above the dashed red line over the left ⅔ of the chart). This is a bullish outlook to the middle of January 2022.
Theory suggests that the market-implied outlook will tend to have a bearish bias because investors, in aggregate, are risk averse and tend to pay more than fair value for downside protection (put options). With this tendency in mind, the clear bullish tilt in the 1.7-month outlook is even more notable.
The market-implied outlook to January 2023 is predominantly neutral, with a slight bullish tilt. The probabilities of positive and negative returns are very close to one another over the next 13.7 months. The probabilities of extreme negative returns are higher than for positive returns for large-magnitude price moves (the dashed red line is consistently above the solid blue line on the right ⅓ of this chart). This is a standard feature of dividend-paying stocks. Dividend payments reduce the upside price potential of stocks relative to downside. The annualized volatility calculated from this distribution is 20.5%.This would be a neutral outlook if investors were risk neutral, but because of the assumed negative bias, this outlook is interpreted as neutral with a slight bullish tilt.
Source: Author’s calculations using options quotes from E-Trade. The negative return side of the distribution has been rotated about the vertical axis.
The near-term market-implied outlook for ED is bullish. The outlook through 2022 is neutral with a mildly favorable tilt. The expected volatility over the next year is 20.5% but is slightly lower over the next couple of months.
Summary
Consolidated Edison has substantially lagged the utility sector over the past decade and has experienced almost zero price gain over the past 12 months. Wall Street analysts have a bearish consensus on ED with a 12-month price target around 10% below the current share price.
The market-implied outlook for ED over the next couple of months is bullish, becoming neutral (with a slight bullish tilt) through 2022 and expected annualized volatility is 20.5%.
With ED’s 3.9% dividend yield and a dividend growth rate of about 2.7% per year, it is not unreasonable to expect a long-term annualized total return of around 6.6%, assuming that ED maintains this dividend growth rate. However, this is not an especially attractive rate of return, given the expected volatility.
Considering the Wall Street consensus outlook, the market-implied outlook, and the fundamentals, I am maintaining my neutral rating on ED.
Trading in financial instruments and/or cryptocurrencies involves high risks including the risk of losing some, or all, of your investment amount, and may not be suitable for all investors. Prices of cryptocurrencies are extremely volatile and may be affected by external factors such as financial, regulatory or political events. Trading on margin increases the financial risks.
Before deciding to trade in financial instrument or cryptocurrencies you should be fully informed of the risks and costs associated with trading the financial markets, carefully consider your investment objectives, level of experience, and risk appetite, and seek professional advice where needed.
Fusion Media would like to remind you that the data contained in this website is not necessarily real-time nor accurate. The data and prices on the website are not necessarily provided by any market or exchange, but may be provided by market makers, and so prices may not be accurate and may differ from the actual price at any given market, meaning prices are indicative and not appropriate for trading purposes. Fusion Media and any provider of the data contained in this website will not accept liability for any loss or damage as a result of your trading, or your reliance on the information contained within this website.
It is prohibited to use, store, reproduce, display, modify, transmit or distribute the data contained in this website without the explicit prior written permission of Fusion Media and/or the data provider. All intellectual property rights are reserved by the providers and/or the exchange providing the data contained in this website.
Fusion Media may be compensated by the advertisers that appear on the website, based on your interaction with the advertisements or advertisers.