The “shoulder season” for natural gas is looming on the market, bringing with it the woe of weak demand and pricing that could further challenge the fuel’s key $2 support.
With the end of last week’s warmth that briefly boosted air-conditioning demand, temperatures are expected to ease by this weekend in the key gas-fired power generation zone of the U.S. Northeast, as more variable weather patterns take over.
To analysts such as Dan Myers of Gelber & Associates in Houston, that could only mean one thing: a new round of price pressures as the onset of amiable conditions that require little or no cooling lead to greater storage rather than burning of gas.
Said Myers:
“Although the western U.S. continues to bake through the end of August, key population centers will get a break (from the heat) and end the latest round of near-record natural gas power demand.”
Ahead of Thursday’s weekly gas storage report due from the U.S. Energy Information Administration at 10:30 AM ET, analysts are forecasting a rounded up estimate of 60 billion cubic feet (bcf) in gas injections for the week ended Aug. 16.
At 60 bcf, the latest weekly addition to storage would be 25% higher than a year ago, considering there was an injection of just 48 bcf during the week ended Aug. 17, 2018. It would also be higher than the five-year (2015-2019) average injection of 51 bcf for the week.
Myers said he expected the “final crescendo of summer temperatures” in the Northeast and other key gas-fired power generation belts during the current week to Aug. 23.
Dominick Chirichella, director of risk and trading at the Energy Management Institute in New York, concurred with that view, saying:
“The driver remains the cool down that gets underway in the 6-to-10 day forecast and spreads across a larger geographical area in the 11 to 14 day period."
“In addition, the market is expecting an above normal injection into inventory further helping to keep any remaining bulls on the sidelines.”
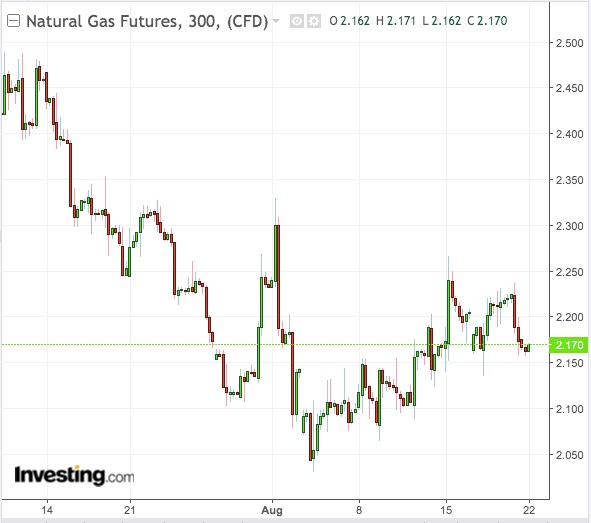
At Wednesday’s settlement, the benchmark September gas contract on New York Mercantile Exchange’s Henry Hub fell 4.8 cents, or 2.2%, to $2.17 per million metric British thermal units (mmBtu).
For now, there is little immediate risk of the contract losing the key $2 per mmBtu support, with its 18-cent buffer above the $1 bracket.

But on the other hand, the dismal price action in recent days once again leaves the market poised for a week in the red, resuming a trend broadly seen since mid July. Until last week’s near 4% rally, Henry Hub’s benchmark gas futures contract lost a cumulative 14% over four weeks. In the current week, the contract is starting at a loss of 1.6%.
Investing.com’s Daily Technical Outlook has a “Neutral” call on natural gas, projecting a bottom of $2.057 and top-end resistance of $2.297.
Myers said the return of cooler-than-normal temperatures in a large swath of the United States will allow injections to climb going into the shoulder season:
“There’s potential to send the market even lower in the coming days.”
